| |
Univers PROF2: PROFESSIONAL PROFILER
|
|
|
 |
|
Univers PROF2 is a professional, accurate, static and dynamic profiling tool.
To find performance bottlenecks or to optimize an
algorithm in a structured way, a profiler is required. The profiler must be fully accurate to base design
decisions upon. The Univers profiler is accurate and incorporates many features
to help you to develop and optimize the critical application source code.
|
|
|
|
|
|
|
Often profilers use system resources, or they extend the code
with small pieces of code per function. The disadvantage is twofold: the profiling is inaccurate and you do not
profile the original code. When a profiler requires a timer it often means that profile
data is gathered when the timer generates an interrupt. The timer's frequency might be user configurable but
still this might be too inaccurate to profile an algorithm.
The Univers Profiler does not have the above mentioned disadvantages. The supported
Instruction Set Simulators implement the timing of a CPU, including caches, branch miss-prediction, etc.
These fast executing models lead to accurate profiling data.
|
|
|
|
|
|
|
The Profiler can be used on a high
abstraction level to decide which part of the code is
best transferred from software to hardware to boost the
application. The Profiler provides also detailed stall
cause information on instruction level to optimize
critical parts of the code on the lowest possible level.
|
|
|
|
|
|
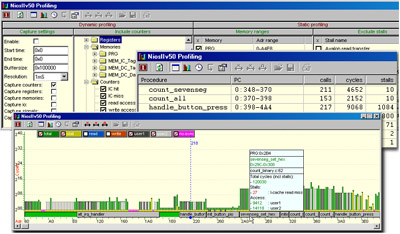
The static profiler gathers timing information on
individual disassembly instruction level. This
information is presented in tabular ASCII format or
graphically. The graphical output shows the program and
data memory space on the X-axis and 'cycle counts' on
the Y-axis. For each instruction and procedure the total execution
cycles, the stall cycles, the stall causes, the amount of
read accesses, etc. is maintained
an presented.
The source code procedures are shown
on the X-axis. Highlighting such a procedure
presents a box with the totals for that
procedure.
When a procedure
includes a loop and you want to know the totals
for that loop, just select the loop's address
range and another box presents the totals for
that loop. (not shown in the figure) |
 |
|
|
|
|
|
|
|
The dynamic profiler gathers timing information on
individual disassembly instruction level. This type of
profiling is very helpful to determine bus loads. On the
X-axis the time is presented. On the Y-axis all kinds of
'count information' can be presented. The amount of
gathered data can be quite extensive, therefore you can
select the time interval in which data is accumulated.
You can perform this type of profiling on memory
accesses, input/output accesses, all sorts of counters,
HDL signals, etc. |
|
|
|
|
|
 Accurate profiler (therefore not based on sampling
techniques)
Accurate profiler (therefore not based on sampling
techniques)
Correct code analysis (the code is not changed, no resources required)
Static profiler
Dynamic profiler
Fully user configurable
ASCII tabular output
Graphical views for both
Static and Dynamic profiling
Direct link to Application window, Disassembly window
and Memory window |
|
|
<
back
|
